
December 3, 2024

May 2009 | Vol. VIII - No. 5
Is Another Toy Retailer Biting the Dust?
Falling Sales and Dirty Stores Forecast Kmart’s Demise
| “… buyers at the other large toy retailers … think a bankruptcy filing of Kmart’s could well pull some of their own vendors down the drain.” |
After the demise of KB Toys, the only second tier, year-round toy retailer left is Kmart. More and more insiders are whispering that Kmart, and its owner, Sears, could hit the dust this year. Since Kmart has about 5 percent of the U.S. toy market — about the same share KB Toys held — its disappearance would not be a positive for toy manufacturers since it would remove yet another alternative to the “big three” in the toy space, Wal-Mart, Toys “R” Us and Target.
 Will Sears survive 2009? Some people are betting it will not. Thirteen-percent shorts of the share float suggest that there are quite a lot of them. Interestingly, buyers at the other large toy retailers are concerned because they think a bankruptcy filing of Kmart’s could well pull some of their own vendors down the drain. And the last thing a buyer wants is a vendor who cannot ship during the crucial fourth quarter.
So, some of them have begun to visit Kmart to measure how much shelf space a given vendors of theirs has there. If they think it is excessive, and hence renders that vendor potentially vulnerable, they will begin to reduce his shelf space and the inventory they have on their own shelves.
Sears/Kmart is the fourth-largest multi-purpose retailer in the United States. This is how the line-up looks like today:
| Rank |
Retailer |
Annual Sales |
Toy Market Share |
| 1 |
Wal-Mart/Sams |
$404.2 billion |
#1 - 30% |
| 2 |
Costco |
$ 73.1 billion |
#5 - 4% |
| 3 |
Target |
$ 65.3 billion |
#3 - 14% |
| 4 |
Sears/Kmart
|
$ 46.7 billion |
#4 - 5% |
| 5 |
Macy’s |
$ 25.6 billion |
N/A - 0% |
Note: Toys “R” Us is the second largest toy retailer, with a market share of about 16 percent. Costco carries toys only during the second half of the year.
A number of stock analysts doubt whether Sears will be able to survive this recession. The following factors influence this thinking:
• The vast majority of Sears’ and Kmart’s stores are located in malls. That is not a good place to be at this time. There is a lot of evidence that consumers shy away from malls because the stores are perceived as being expensive. Store traffic, as a result, is way down, as per Shopper Trak. This proved KB Toys’ undoing and is also affecting Macy’s as well as Sears.
America’s Research Group conducts a national study of 1,000 consumers in the general population every other month to determine shopping trends in 26 retail shopping categories. This information is displayed below for the months of March by per capita spending in each category and percentage of population shopped.
| Percentage of Population |
March ‘04 |
March ‘05 |
March ‘06 |
March ‘07 |
March ‘08 |
March ‘09 |
| Discount Stores |
84.5% |
88.7% |
84.7% |
86.1% |
93.7% |
89.0% |
| National Dept. Stores |
25.7% |
28.2% |
40.0% |
26.0% |
28.2% |
23.3% |
| Per Capita Spending |
March ‘04 |
March ‘05 |
March ‘06 |
March ‘07 |
March ‘08 |
March ‘09 |
| Discount Stores |
$117.13 |
$150.26 |
$220.53 |
$198.48 |
$236.46 |
$206.12 |
| National Dept. Stores |
$ 29.30 |
$ 34.81 |
$ 58.63
|
$ 33.98 |
$ 54.14 |
$ 36.67 |
Since March 2006, National Department Stores dropped in terms of per capita spending by 37 percent and in terms of percentage of population by nearly half.
• In keeping with the statistics above, Sears has suffered a persistent sales decline over the past four years. In fact, none of its three main operations [Kmart, Sears Domestic and Sears Canada] has, in the past four years, experienced a single quarter that was up compared to the preceding year. Here are the moving annual totals by quarter:
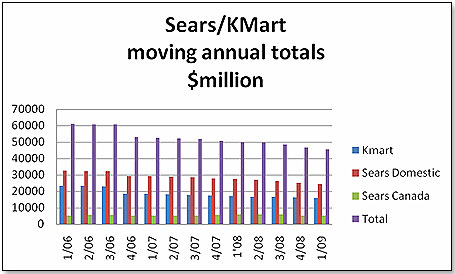
I am comparing this below with two other retailers: Target, which is very similar in focus to Kmart; and Macy’s, which is mall-based and very similar in character to Sears:
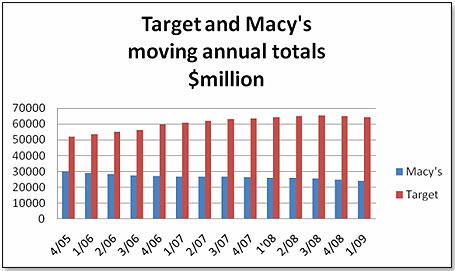
Macy’s shows the same picture as Sears.
• In addition, Foresee Results has just published its Retail Satisfaction Index. The study measured satisfaction among shoppers who visited the site, regardless of whether they ultimately executed a purchase online, which provides insight into the performance of retail websites as research and purchase channels. Wal-Mart and Target did well:
| Retailer |
Index 2007 |
Index 2008 |
% Change |
| Wal-Mart |
74 |
78 |
+ 5.4 |
| Target |
72 |
75 |
+ 4.2 |
| Costco |
72 |
72 |
0.0 |
| Sears/Kmart |
70 |
70 |
0.0 |
| Macy’s |
71 |
70 |
- 1.5 |
• There is anecdotal evidence that vendors are getting concerned about Sears’ ability to pay its bills. These vendors remember much too well the Kmart bankruptcy of 2002, which caught many of them unaware. They are not going to go through a similar experience again, if they can help it. They are not reassured by the fact that Moody’s just dropped its rating on Sears from Ba2 to Ba3. A Ba rating means it is a “Questionable security. Ability to meet obligations may be moderate.” Moody's adds a numerical modifier, from 1 (at high end of category) to 3 (at the lower end) to indicate the approximate ranking of a company in the particular classification. In other words, Sears’ paper at Ba3 is now rated just a notch above junk status.
• If there is one persistent complaint that consumers share with stock analysts, it is that the appearance of Sears — and more so, Kmart — stores leaves a lot to be desired. They are dirty, badly lit, and often in dire need of basic repairs, of such things as cracked windows, shelving that is out of kilter, and stained floors. This is not the fault of the staff; it is a function of no money. We just need to look at the capital expenditures per square foot, comparing Sears, Target, Macy’s and Wal-Mart, to see the problem:
| Retailer |
Square Feet of Stores |
Capital Expenditure - 2008 |
Capital Exp./Sq. Ft |
| Wal-Mart U.S. |
588,449,000 |
$9,100,000,000 |
$15.46 |
| Sam’s |
79,408,000 |
$ 700,000,000 |
$11.34 |
Target
|
222,420,000 |
$4,369,000,000 |
$19.64 |
| Sears/Kmart |
300,000,000 |
$ 497,000,000
|
$ 1.65 |
| Macy’s |
146,664,000 |
$1,105,000,000 |
$ 7.53 |
There are two major problems with Sears’ strategy. One is that schlocky stores turn consumers off. The other is that the need for repairs does not go away — it tends to be cumulative until things get totally out of control. This pent-up need could well be regarded as an off-balance sheet liability. Kmart and Sears have about 300 million square feet of property under their own management, which does not include stores operated by third parties. If you conservatively assume the catch-up factor to be three years and $5 per year, you’re looking at an expenditure of $4.5 billion.
• There is a fair amount of talk about all the real estate owned by Sears and how this would lend itself to a major financial restructuring in case of need — sell the real estate and lease it back. I do not think there is any leverage there.
This is how the real estate of Sears breaks out, approximately:
Owned
|
|
Type |
Number |
Sq. Ft |
Sq. Ft. |
| |
Kmart
|
Discount Stores |
160 |
92,00 |
14,720,000 |
| |
|
Super Centers |
34
|
165,000 |
5,610,000 |
| |
Sears |
Mall Stores |
521 |
134,000 |
69,814,000 |
| |
|
Essentials |
18 |
134,000 |
2,412,000 |
| |
|
Specialty
Dist.
|
61 |
40,000 |
2,440,000 |
| |
Both |
Centers |
10 |
800,000 |
8,000,000 |
| |
|
Office |
1 |
2,000,000 |
2,000,000 |
| |
Total Owned |
|
805 |
|
104,996,000 |
| Leased |
|
Type |
Number |
Sq. Ft |
Sq. Ft. |
| |
Kmart |
Discount Stores |
1167 |
92,000 |
107,364,000 |
| |
|
Super Centers |
21 |
165,000 |
3,465,000 |
| |
Sears |
Mall Stores |
339 |
134,000 |
45,426,000 |
| |
|
Essentials |
57 |
134,000 |
7,638,000 |
| |
|
Specialty
Dist. |
238 |
40,000 |
9,520,000 |
| |
Both |
Centers |
30 |
800,000 |
24,000,000 |
| |
|
Office |
0 |
2,000,000 |
0 |
| |
Total Leased |
|
1,852 |
|
197,413,000 |
[Note that the table above does not include the 857 dealer stores operated by independents, with an average of 8,000 square feet each.]
I talked to a friend of mine at Sears’ Real Estate Department and asked him the approximate value of the owned real estate. His reply was that this would currently be somewhere between $50 and $75 per square foot. We are hence looking at a theoretical value of $6.25 billion. Whether this could, in fact, be realized is a major question in the current, very depressed commercial real estate market. Recently, Credit Suisse Securities valued Sears’ real estate holdings at $4.7 billion. Both numbers pale in comparison to what is now in the balance sheet of Sears, which valued on Jan. 31 its land and buildings at $8.096 billion. Add to this the catch-up maintenance factor mentioned further above and you will see that the real estate asset in the Balance Sheet is questionable. I do not think Sears’ salvation can be found in its real estate.
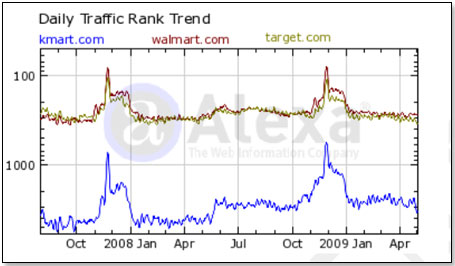
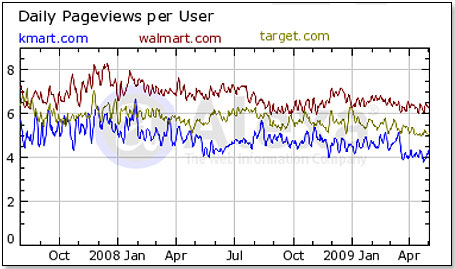
• There is one area where Sears/Kmart could steal a march on their competition — the Web. The Internet represents a major growth opportunity, as sales excluding travel are expected to grow 11 percent this year, to $156 billion, whereas brick-and-mortar sales this year are expected to decline by 0.5 percent. Again, however, Sears/Kmart disappoint, as the graphs below bear out:.
Kmart vs. Wal-Mart vs. Target – Wal-Mart and Target beat Kmart hands down, both in terms of traffic as well as consumer interest:
.
Sears vs. Macy’s vs. JC Penney – Again here, Sears solidly occupies the bottom rank both in terms of traffic as well as in terms of consumer interest:
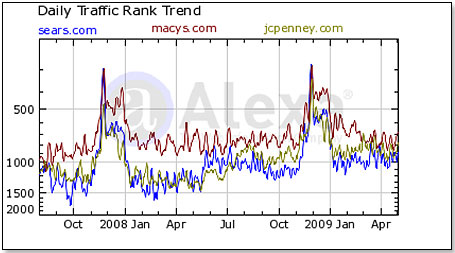
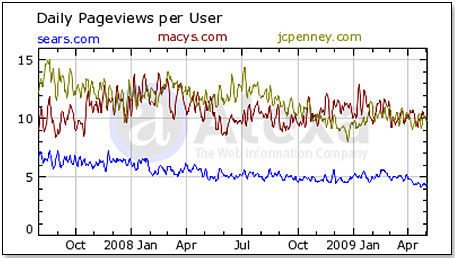
I have frequently found that the degree of creativity and success with which a company handles its online business tells a lot about the way it runs its business overall. Companies in which financial people are the drivers tend to have poor Web traffic patterns in comparison to those that have marketing people in charge. The Web traffic patterns of Mattel versus Hasbro is a case in point, with Hasbro being the stronger of the two. And we see the same pattern with both Kmart and Sears versus their immediate competitors.
Copyright © 2024 TDmonthly®, a division of TOYDIRECTORY.com®,
Inc.


 Will Sears survive 2009? Some people are betting it will not. Thirteen-percent shorts of the share float suggest that there are quite a lot of them. Interestingly, buyers at the other large toy retailers are concerned because they think a bankruptcy filing of Kmart’s could well pull some of their own vendors down the drain. And the last thing a buyer wants is a vendor who cannot ship during the crucial fourth quarter.


